Your Java Application in Detail: Performance Analysis with JMX and JDK Mission Control

When it comes to analyzing the performance or behavior of a Java application, Java Management Extensions (JMX) is a valuable tool. In this article, we will explore how you can utilize JMX to profile your application, particularly with the use of JDK Mission Control (JMC).
JMX: A Quick Overview
JMX provides a simple and standardized method for monitoring and managing Java applications. With JMX, you can access various metrics and information about your JVM and even adjust real-time settings.
With JMX, you can quickly gain insights into the following metrics and data:
1. Memory Usage
Using JMX and JMC, you can easily see how much memory your application is using at any given time.
- Heap Memory: How much of the allocated heap memory is currently in use?
- Non-Heap Memory: Which portion of non-heap memory is in use, e.g., the area for class metadata.
2. Thread Information
Analyze how threads in your application operate and identify potential bottlenecks.
- Number of Active Threads: How many threads are currently active in your JVM?
- Thread Blocking: Which threads are blocked and waiting to access a resource?
3. JVM Performance
Understand how well your JVM is performing.
- Just-in-Time Compilation: How often does the JIT compiler become active, and how does it impact performance?
- Garbage Collection: How frequently does it occur, how long does it take, and what effect does it have on application performance?
4. Class Loading Statistics
Find out how classes are loaded and unloaded in your JVM.
- Number of Loaded Classes: How many Java classes have been loaded so far?
- Number of Unloaded Classes: How many classes have been unloaded to date?
5. MBean Attributes and Operations
MBeans offer a plethora of attributes and operations that provide information about various aspects of the JVM and the application.
- Example: A database MBean might provide information about the number of active connections, average query time, or the number of failed connection attempts.
Installing JDK Mission Control (JMC)
To access and visualize the JMX interfaces, we need a suitable tool. Oracle offers JDK Mission Control for free.
- Download: Download JMC from the official Oracle website.
- Installation: Run the downloaded installer. The process is straightforward and self-explanatory.
- Launching JMC: After installation, you’ll find Java Mission Control in your program directory. Simply start it.
Connecting JMC to Your Application
Now that JMC is installed, we want to connect it to our Java application.
JVM Parameters for JMX
Before we can use JMC, we need to ensure our JVM is started with the correct parameters:
java -Dcom.sun.management.jmxremote \
-Dcom.sun.management.jmxremote.port=YOUR_PORT \
-Dcom.sun.management.jmxremote.authenticate=false \
-Dcom.sun.management.jmxremote.ssl=false \
-jar your-app.jar
Let’s take a closer look at each of these parameters:
-Dcom.sun.management.jmxremote: Enables JMX monitoring.-Dcom.sun.management.jmxremote.port=YOUR_PORT: Specifies the port on which JMX should listen. ReplaceYOUR_PORTwith a desired port.-Dcom.sun.management.jmxremote.authenticate=false: Disables authentication. In a production environment, you would want to enable authentication.-Dcom.sun.management.jmxremote.ssl=false: Disables SSL. In a production environment, you should enable SSL.
Establishing Connection
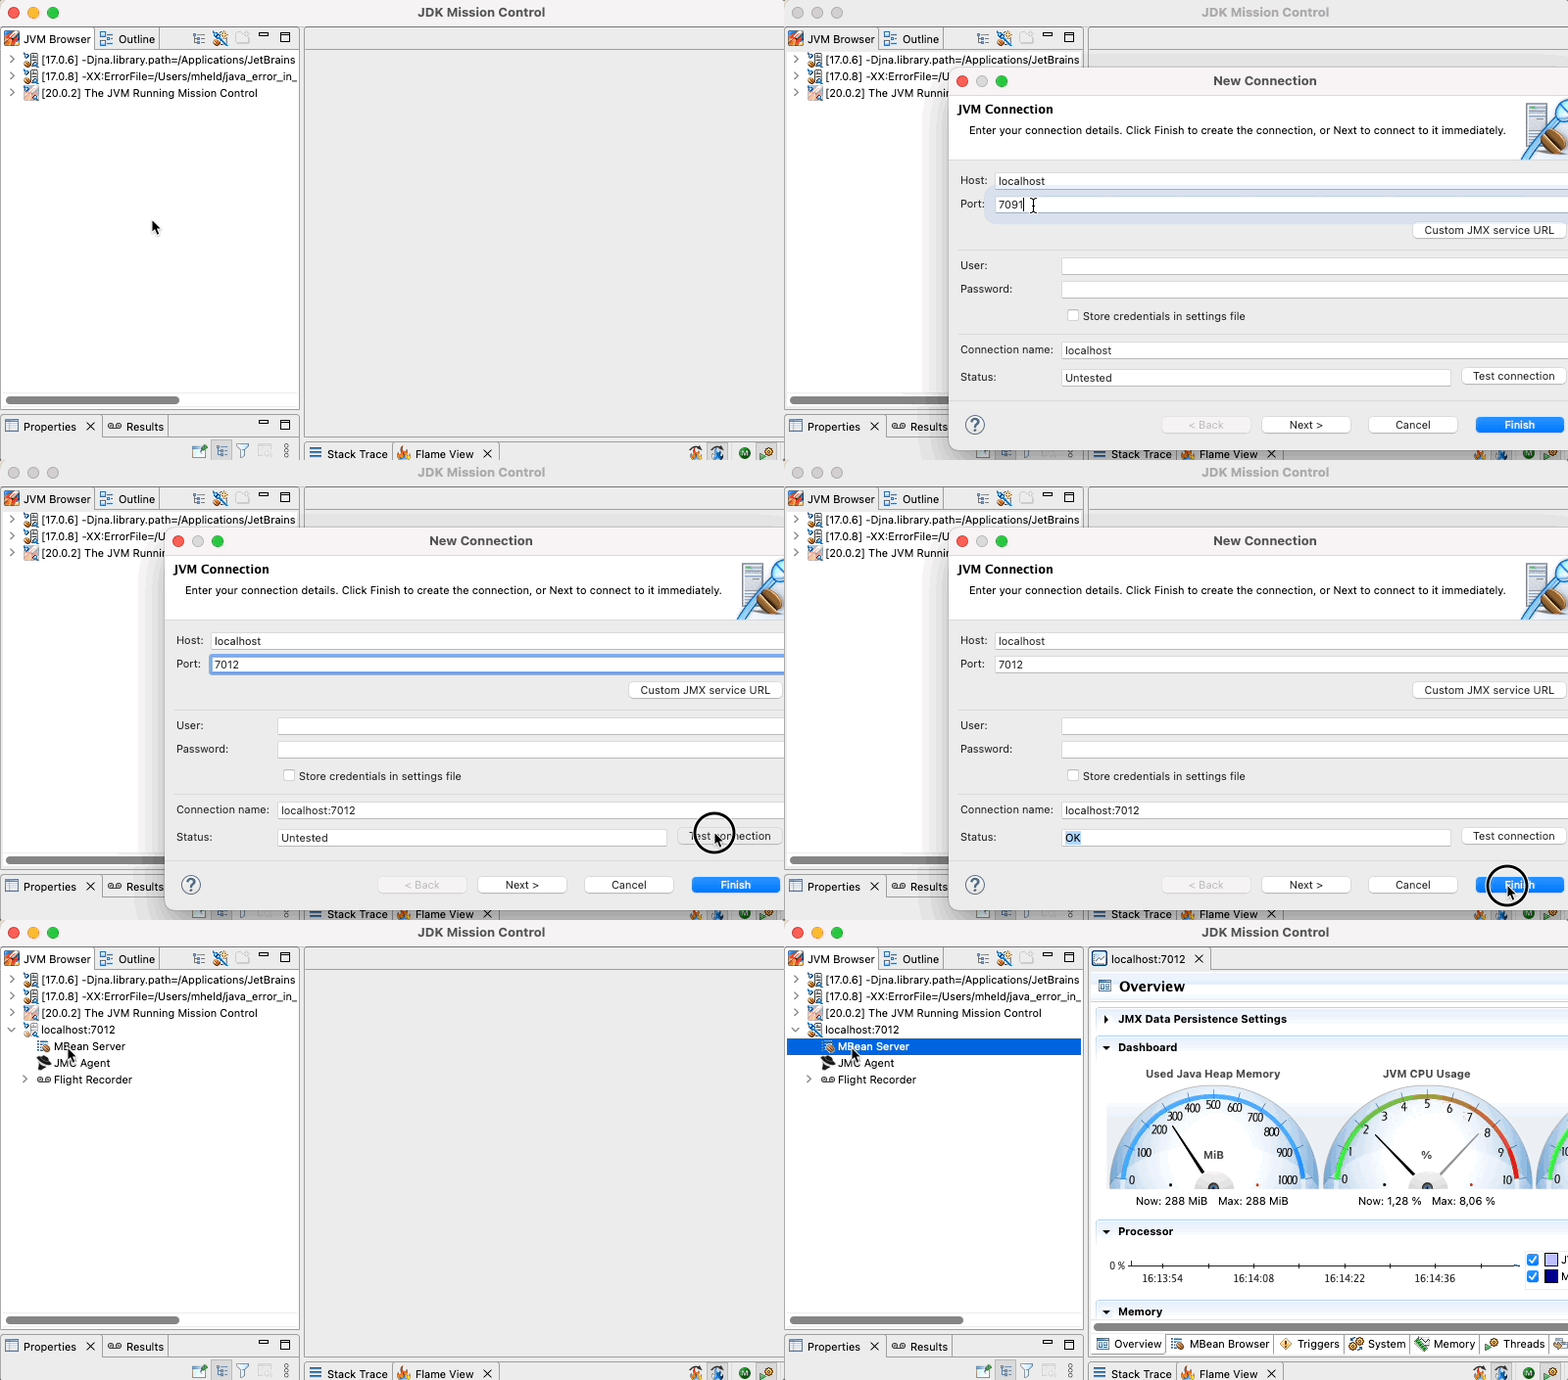
- Open JMC and navigate to “Flight Recorder”.
- Click on “New Connection” and enter your JMX server details (Host and Port).
- If everything is correctly configured, you should now be able to establish a connection.

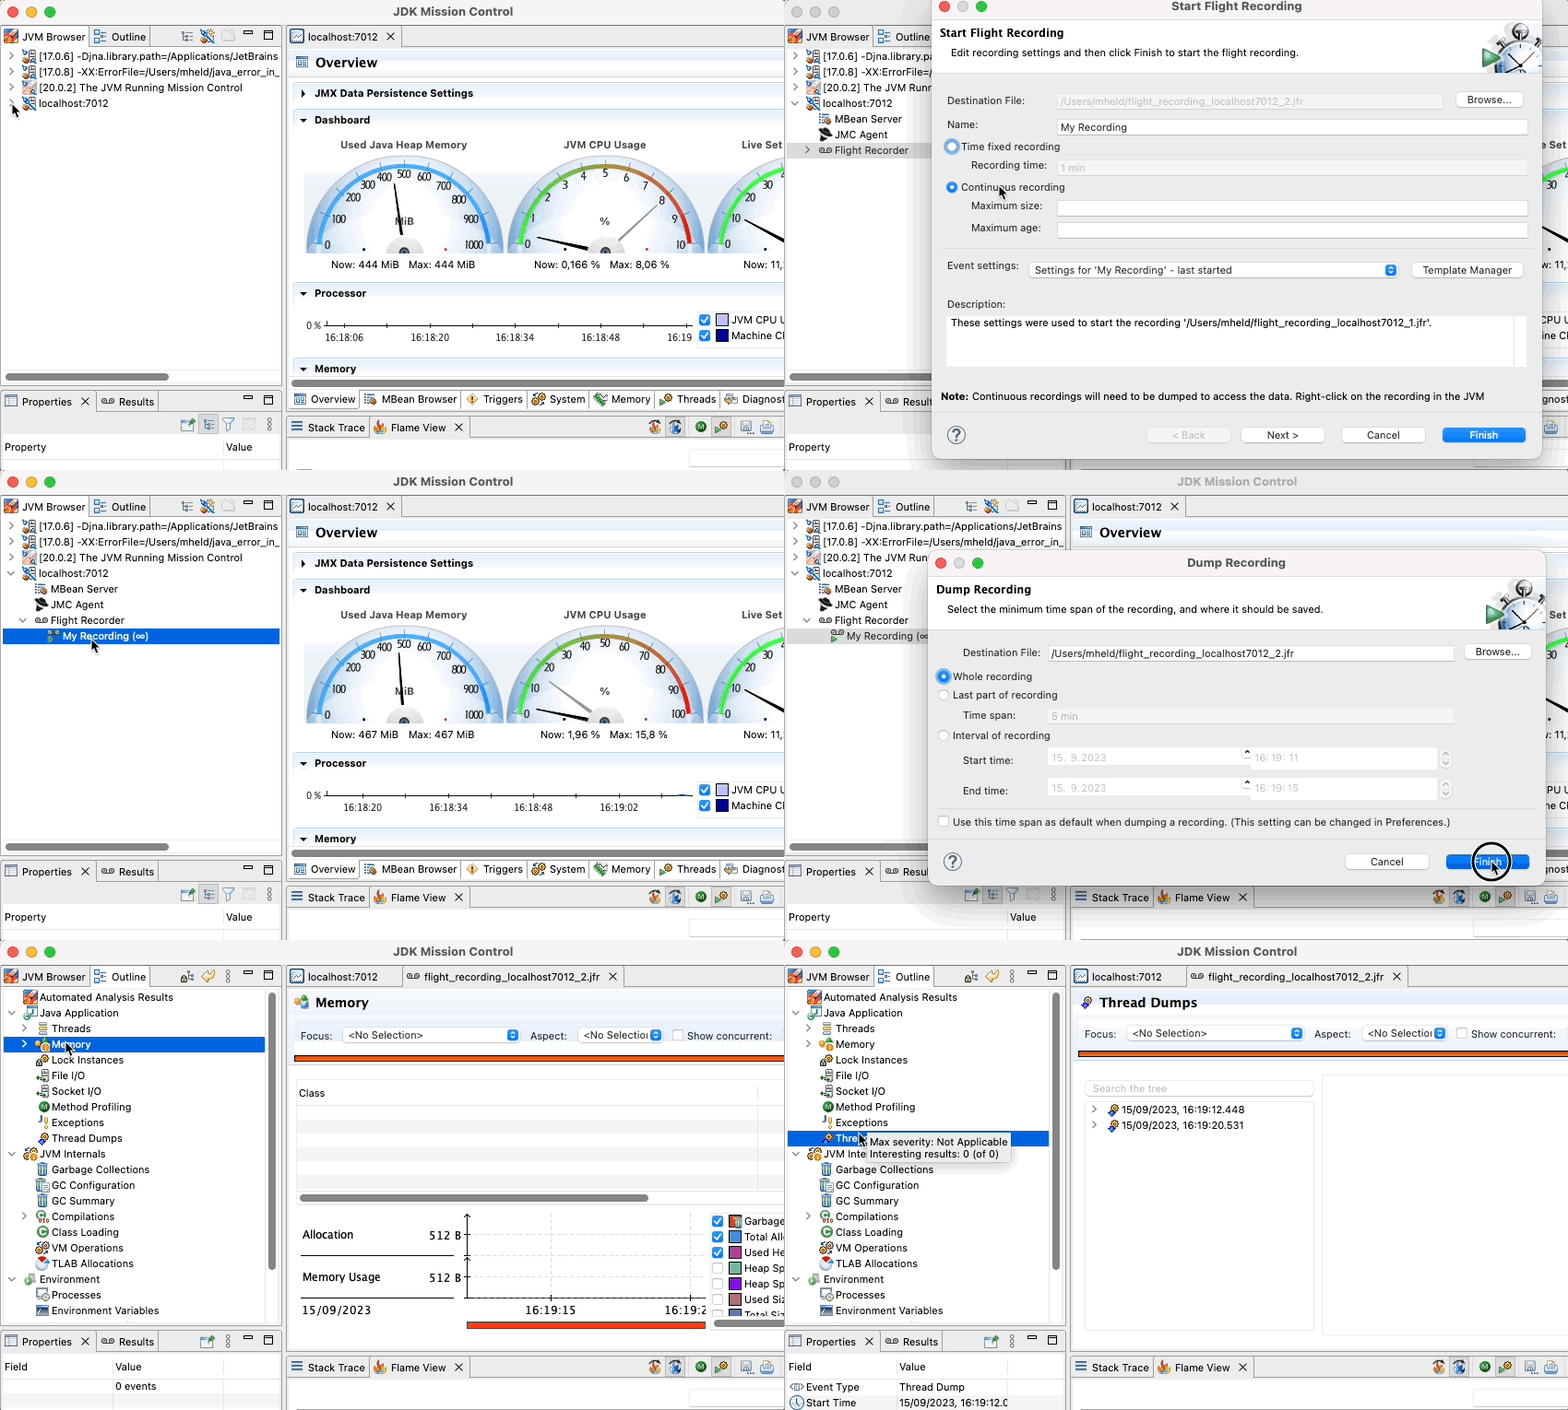
Start Profiling!
Now that JMC is connected to your application, you can start the “Flight Recorder” and gather detailed data about the performance and behavior of your application.

Explore!
JMX, when combined with Java Mission Control, offers a powerful way to understand the inner workings of your Java applications. The ability to monitor and analyze in real-time can be invaluable in identifying bottlenecks and making optimizations. Happy profiling!
